It has been 2 months since my last post on this blog. While the oversold condition and moving averages in US stocks proved to be a base to push them higher, the mid 50s in Bitcoin became the base it would continue to return to.
As we start the 2nd half of 2024 with the 4th of July behind us, I would like to share some very interesting patterns that have unfolded.
Bitcoin - Sentiment and Fibonacci: Encouraging for Bulls
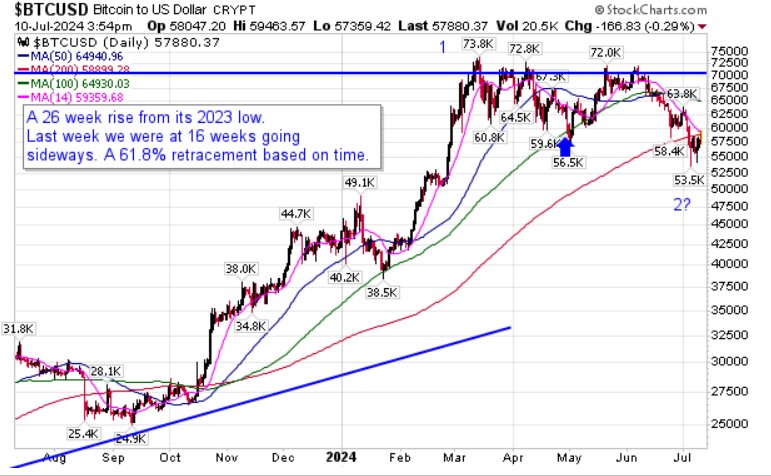
In the few weeks, I have been looking at a Fibonacci Pattern. If we start at the beginning of wave 1, 9/11/23, and stop at the end wave 1, 3/13/24, we will have traveled 26.28 weeks. If I start with the golden ratio (trading tools use 61.8%), we discover that 16.24 weeks later we land on July 5th, which is where find the current low of 53.5.
At the same time, we discovered an interesting pattern in the Coin Market Cap Fear & Greed Index. The lowest reading in 2023, 31.83, was on 9/11. The lowest reading so far in 2024, 35.68, was on 7/5.
Remember also, that on 9/11/23 Bitcoin reached 24,959. On 7/5/24 it reached 53,528, more than double the price it was 10 months ago.
US Stocks: Can these 7 (or 8) Companies Take Us to Infinity...Before a "Correction"?
It is clear from looking at the concentration of the SPX 500 or the NDX 100 that ALL investors in these indices are extremely dependent on the top tech companies, like the 2000 and 2007 top. Notice from the charts below, that 7 companies represent a third (1/3) of the value of the S&P 500, and 8 companies represent a half (1/2) of the value of the NDX 100.
(Source: Slickcharts.com)
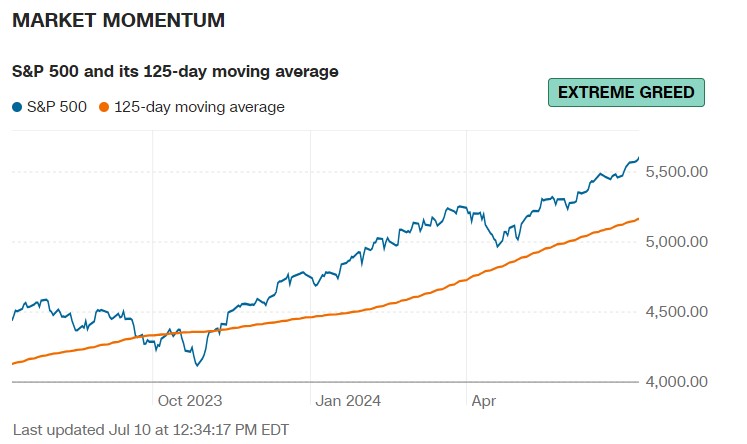
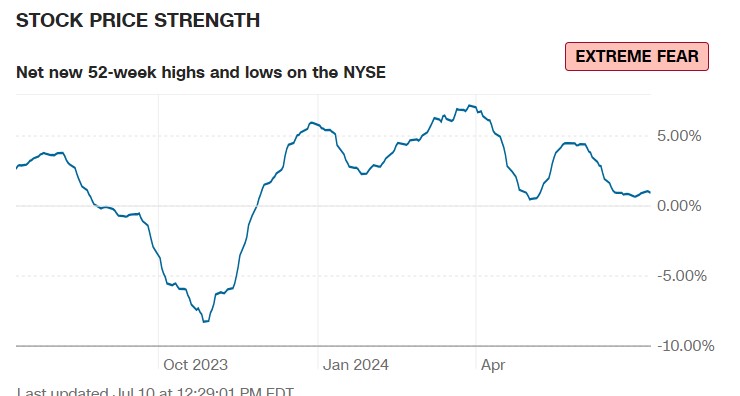
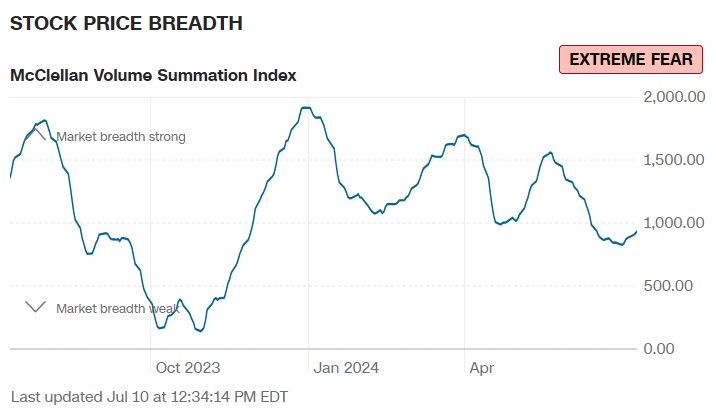
Notice the difference between these sentiment indicators as of July 9th.
(Source: CNN Fear and Greed Index)
When the S&P 500’s momentum tells the crowd “get in, get in!!”, and the put/call options ratio is the lowest in a year, “buy calls, who needs puts for protection should a declining market arrive”, while stock breadth is weak (fewer stocks are participating in the rally), these technical sentiment indicators are warning ALL investors…”think change”, even if most do not know it.
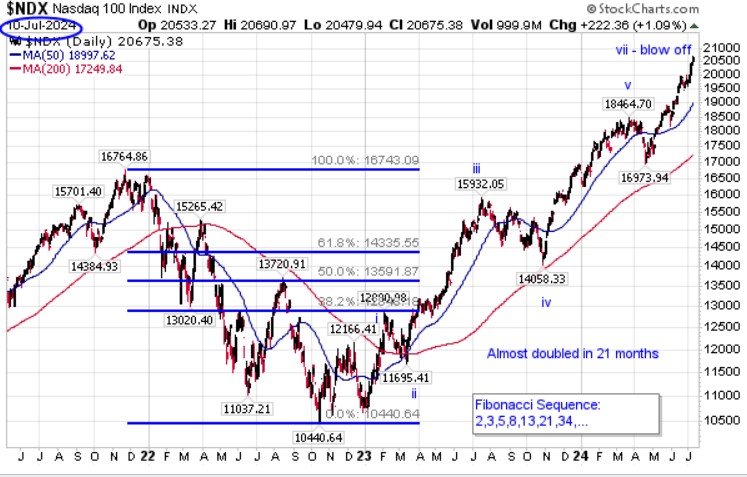
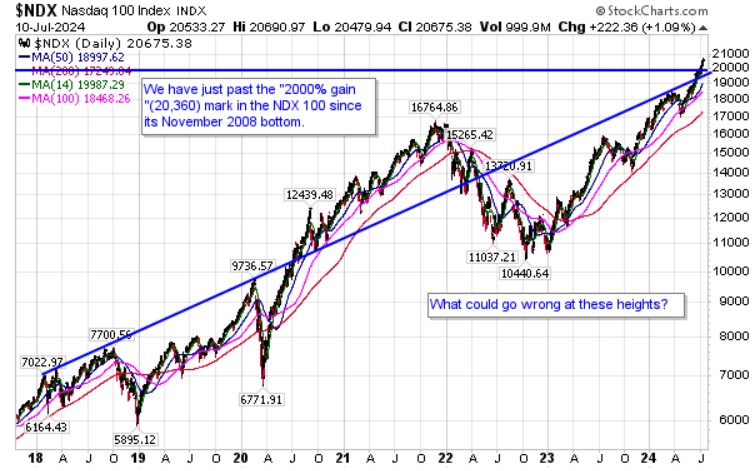
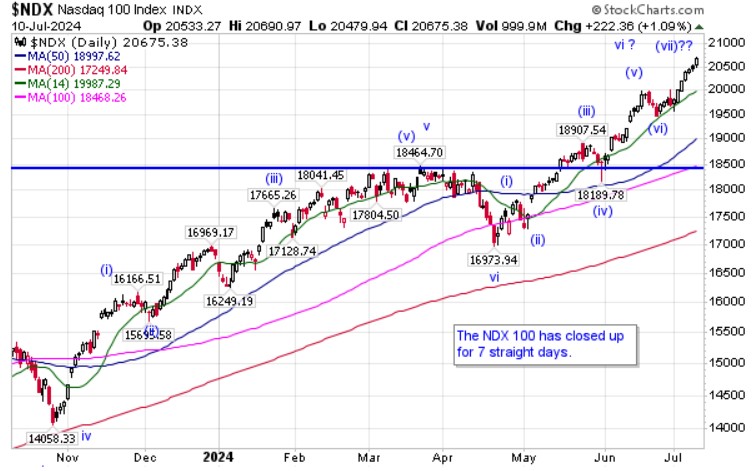
Finally, I find the charts below fascinating.
21 months from the 10/13/22 low will be this Saturday. As you can see, the NASDAQ 100 has almost doubled in under 2 years…and we continue in the land of “all times highs are forever”.
We have now seen another major mark in US stocks. In American history, there has never been a time where investors saw a broad stock market index produce a 2000% gain, simply by holding a stock index for a little under 16 years. What could possibly go wrong? Are there really any signs around us that look negative or dangerous?
(Charting Source: StockCharts.com)
I could talk about other major things developing in markets and money, but I believe just chewing on Bitcoin and the NDX 100 are enough for today.
If you have a question or would like to make a comment, please post it below. You can also respond by using the group email that alerted you to this post.
As always, please share with others if you find this of value. Thanks.
Disclaimer: Best Minds Inc was closed in 2018. I am retired. Nothing I am writing should be taken as advice to buy or sell any form of security or asset. Everyone must study and consider their own situation before putting money anywhere, as well as understand they are living in a time where major changes at the highest levels of money are taking place. These writings are free.










Yorumlar